Estimating the electricity consumption of a dedicated server
By Guillaume Subiron, system administrator and contributor to the Energizta project.
As we see more and more carbon calculators popping up to assess the impact of “the cloud” (or even the impact of an email or the display of a web page), we wanted to go back to the source of all these systems by asking ourselves a seemingly simple question: how much does a computer consume, in particular a physical server?
Let’s take a simple example, which we will follow throughout this article, an average server from the last ten years:
- Intel Xeon CPU around 4 cores at 3.5Ghz
- 32 to 64GB of RAM
- 2 to 3 SSDs of 256 to 512GB each
- no graphics card
This server represents the majority of the Pro range at Dedibox, or the Advance range and now the Rise range at OVH.
So how much does this server consume? Idle, or fully loaded…? Assuming it’s idle, how much does it consume?
A year ago we started surveying some system administrators working in data centers, and got almost all the answers on the spectrum between 5W to 200W.
This was a little like buying a petrol car, and the manufacturer telling you that it consumes 0.1L per 100km. You know deep down that it must be between 5 and 15L per 100km, but can’t say for sure.
Similarly, if we don’t know what a physical server consumes, we give the carbon calculators power to announce whatever they want. We start with a server where we have no idea of the magnitude of its consumption, we then add a more or less complex application architecture on top, and we end up with abstract figures that are impossible to assess.
So, how much does our server consume?
Well, it’s not simple.
“Measuring” electricity consumption
RAPL / Scaphandre
Nowadays, the most commonly accessible source for measuring the electrical consumption of a server is an Intel API called “RAPL” (Running Average Power Limit). This API gives access, from the operating system, to the power consumption of the processor and RAM. How it works is very poorly documented; depending on the generation of the processor it may be a measurement (with a sensor) or an evaluation based on the state of the processor. Sometimes it includes RAM, sometimes not. We sometimes even find a global measurement for the entire machine (psys)…
https://hubblo-org.github.io/scaphandre-documentation/explanations/rapl-domains.html
Notably it is on RAPL that the PowerJoular, PowerAPI, and Scaphandre tools are based.
On our example server above, when idle RAPL gives us between 3 and 10W, i.e. less than an LED bulb. Under load, the consumption can go up to around 50 or 60W.
However, this only includes the CPU and RAM, which is not the full story. On a server there are also hard drives or SSDs, a network card, a motherboard, a power supply, and sometimes a RAID card, a GPU, etc.
And how much does all this consume?
Well… it’s not simple.
Power meters
Ideally, to measure the overall electricity consumption of a server, we would need to connect it to a power meter. Unfortunately this is impossible on dedicated hosting offers; as a customer we do not have the freedom to go and plug in equipment at the data center. Even if we could, it would require a lot of equipment. A power meter costs around twenty Euros, not too bad for an experiment, but we can’t put one behind every server. At a larger scale the cost is even higher, a rackmount SmartPDU costs significantly more.
IPMI
Luckily, on some servers we can obtain the power consumption of the power supply via IPMI, a hardware management interface. This is not the case at OVH (the required cable is missing), but it is the case at Dedibox.
This is good news for us, as we have 200 Dedibox servers on hand. We can use them to compare the electricity consumption supplied by RAPL/Scaphandre to the overall consumption.
So what? What does this tell us?
Well… it’s really not that simple, but we’ll try to explain with some pictures.
Comparative study: RAPL vs Global
For this study, we developed Energizta, a script capable of taking a snapshot of the state of a server every 10 seconds (power consumption from RAPL and IPMI, but also temperature, CPU usage, disk, network, RAM, etc.). This data is then averaged per hour and aggregated into a database.
This script was executed for 6 months on more than 200 servers administered by Sysnove, as a contribution to Boavizta.
On the graphs below, each point represents the average of 1 hour of measurements taken every 10 seconds. We are interested in general trends and orders of magnitude.
Note that we have chosen to round all measurements to the nearest Watt. This is more than sufficient for our work, and we certainly do not want to give the illusion of having more precision.
“Simple” cases
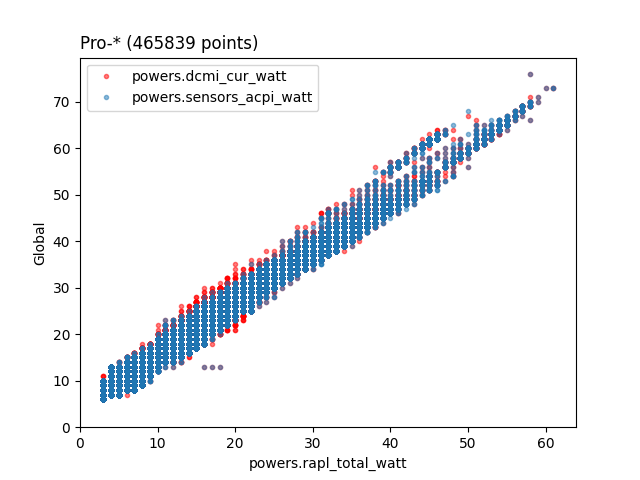
The graph above represents, on the x-axis, the CPU and RAM consumption estimated by RAPL. On the y-axis we have the overall consumption (a priori…) obtained by IPMI (or DCMI, or sensors, but I’ll spare you the details).
On these servers (150 servers graphed for 4 months), we can see that RAPL works quite well. We see a linear trend between RAPL and the overall electricity consumption.
If we take the very simplistic hypothesis that an SSD consumes constant 2W, we arrive at a model: Global = RAPL + 2W * nbSSD.
On this dataset, this model makes it possible to predict the IPMI measurement with an average error of 0.62W, a standard deviation of 1.6W, and a maximum error of 12W!
RAPL works about as well when idle at < 1 load average (0.75W average error, 1.3W standard deviation, 5W maximum), as when the server is loaded at > 5 load average (2.4W average error, 2.5W standard deviation, 12W maximum).
Not bad, huh? But it gets complicated…
Less simple cases
Here is the Pro-4-L (7 servers graphed for 4 months):
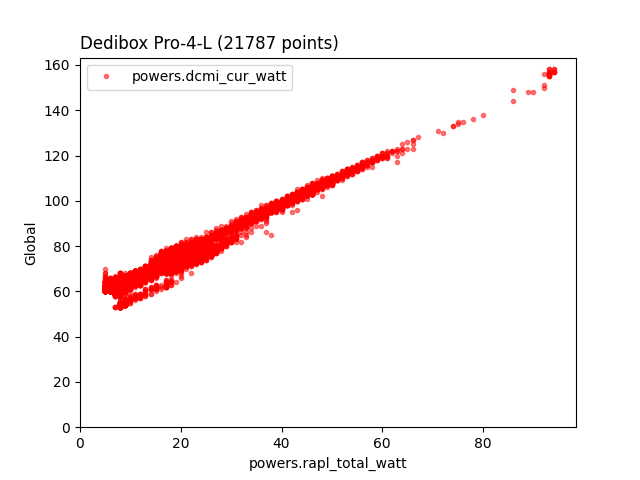
We note that this time the graph is shifted upwards.
Using the previous model, Global = RAPL + 2W * nbSSD, we see an average deviation of 50W, with 2.4W standard deviation. In short, the graph is linear like the previous ones, but shifted upwards by 50W.
In other words, an additional 50W is consumed somewhere other than the CPU and SSDs.
Unfortunately this is not the only place we see this effect, here is a plot for around fifteen similar servers:
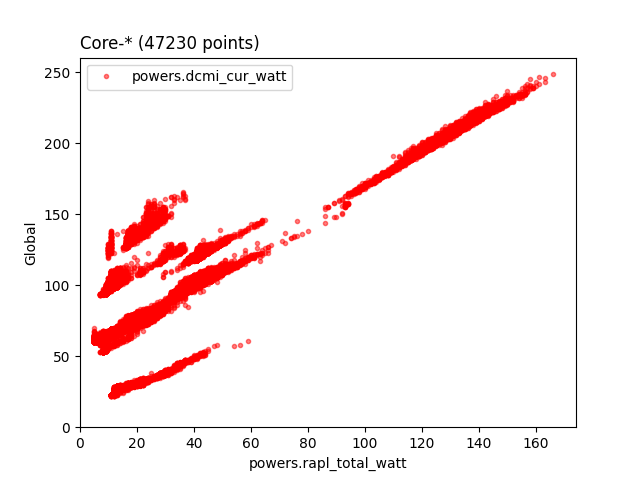
So, where do these 50W get consumed? Well… we don’t know for sure. We first thought it was an IPMI error on these servers, a calibration problem, but then we dug a little deeper.
There is a major difference between the “simple” Pro- and the Pro-4-L, but it requires a little technical understanding. The Pro-4-L is a classic 1U Dell DSS1510 server, but “simple” Pros are “blade” servers, meaning that part of the hardware is shared between several servers in a chassis.
Which part ?
Well, the power supply, the fans…
Can all this explain a difference of 50W?
Perhaps. On this Pro-4-L for example, there are 5 fans which can each draw 14.4W (so 72W in total). According to our observations, they are running at around 10% of their capacity. Assuming a linear consumption we can thus estimate that they only represent 7W on our graphs.
And the rest ?
Well, even if the order of magnitude seems credible, we don’t yet know how to explain it.
And with a power meter?
To get to the bottom of it, we carried out a study on an OVH server with a power meter (precision +/-5W). We measured electricity consumption every 5 seconds over a day, and ran various stress tests to cause fluctuations:
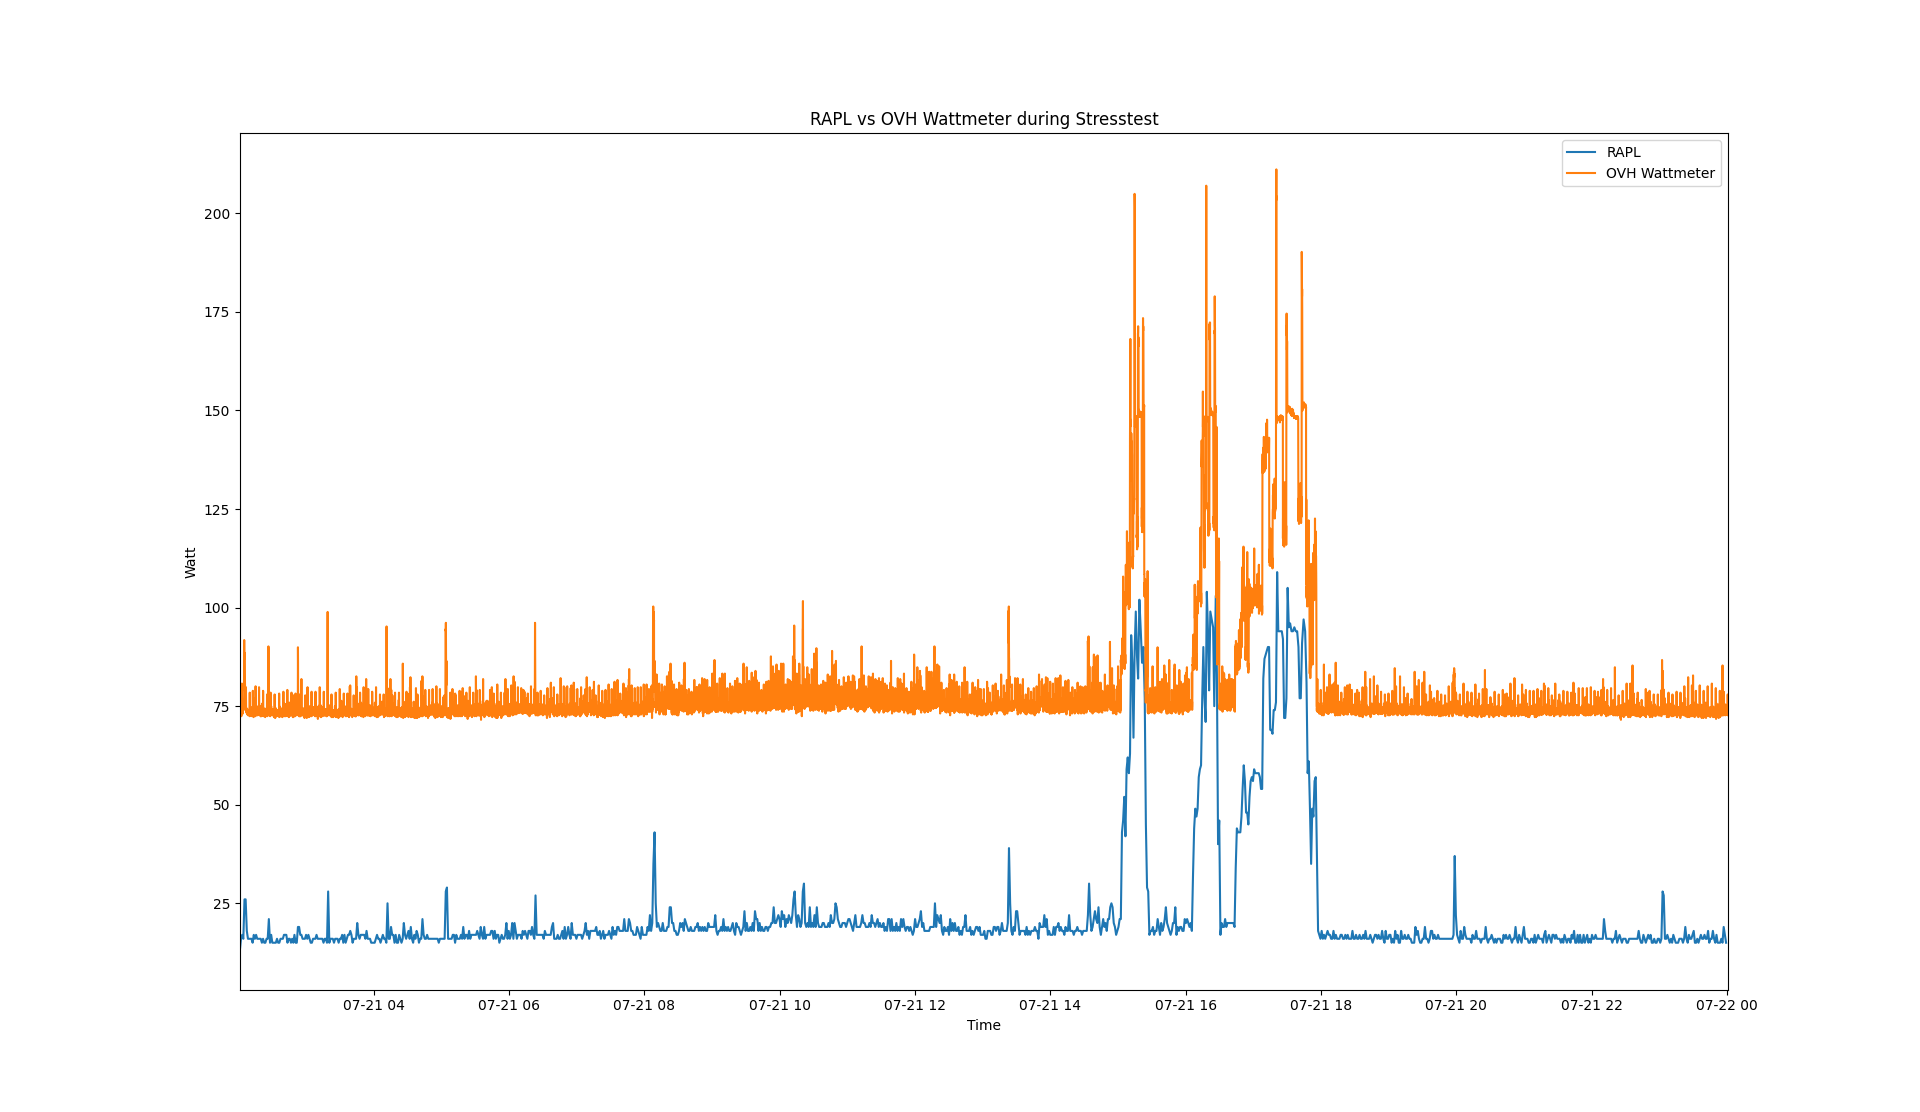
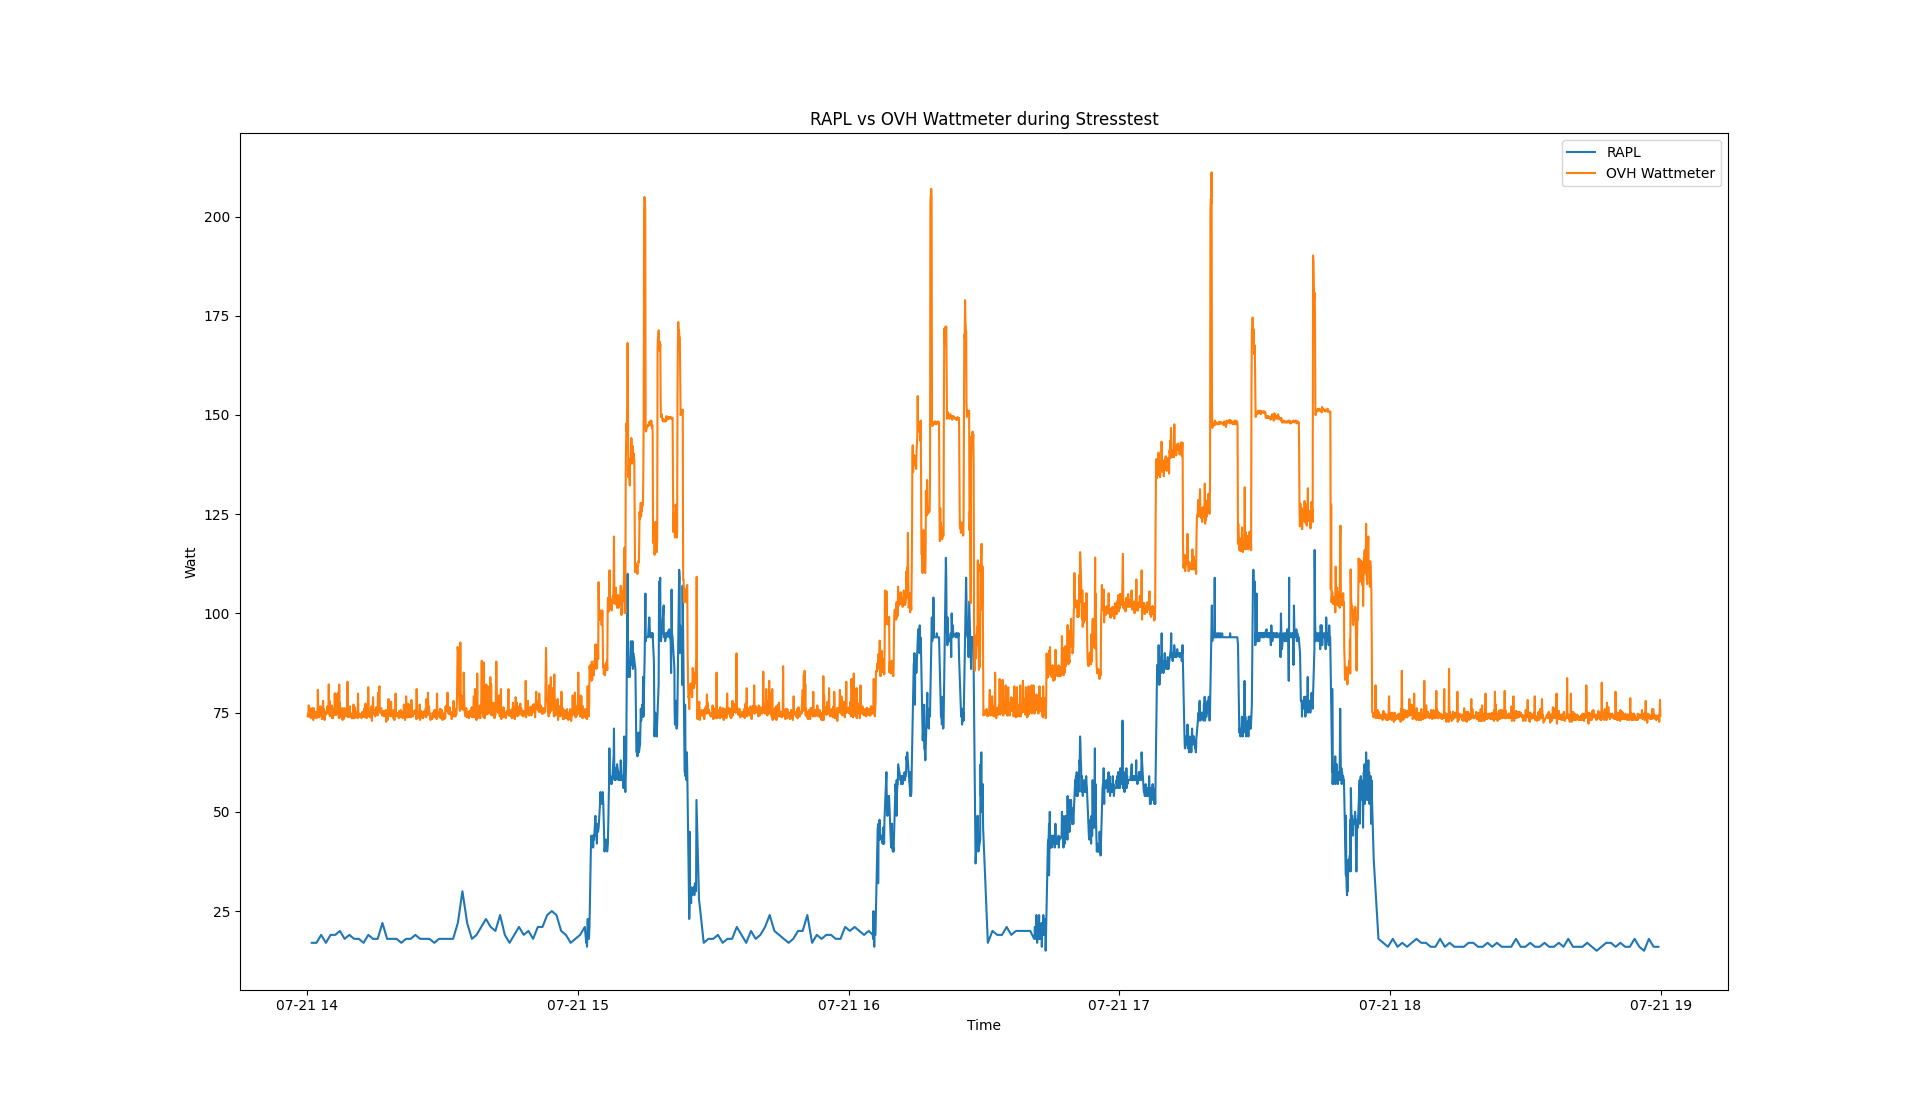
Here too the result is very clear: a 55W difference.
Why? Well, that part is still not clear…
We are continuing our research, and hope that the answer will be the subject of a future article.
Returning to the simple case
These 50W differences complicate the cases that we previously thought were simple. We can no longer be satisfied with the model of Global = RAPL + 2W * nbSSD, because we must at least take into account the fans which rotate at the chassis-level, and assign them to each blade. Ideally these costs would also be allocated in proportion to the consumption of the blade versus the consumption of the chassis. It’s possible that further analysis of these 50W differences will give us more components that need to be distributed in this way.
Furthermore, this complicates things enormously on dedicated hosting offers where, as a customer, we do not have the exact hardware specifications of the underlying servers.
Conclusions
So, the typical server we described earlier, how much does it consume? So, the typical server we described earlier, how much does it consume?
According to our measurements, we can generally conclude that:
- When idle (<0.1 load), it consumes between 10 and 60W
- Under normal activity (0.5 to 1 load), between 20 and 80W
- And up to 80, 150 or even 200W if we really load it
Although this is vague, it’s a start; it gives us the first orders of magnitude.
The problem with this level of imprecision is that it can quite quickly tip a study towards bad conclusions, and result in a bad strategy.
To be more precise:
-
On the Intel Xeon E3 and E5, RAPL seems to give a very good assessment of the variable power consumption of a server. On our dataset of 150 servers, measured every 10 seconds for 4 months and averaged per hour, RAPL is perfectly linear with overall consumption…
-
However, on idle servers, an error of 5W can represent more than 50% of the overall power consumption. What explains the difference over an hour between a value of
(10W RAPL, 12W Global), and a value of(10W RAPL, 20W Global)? In our first study, we found no simple correlation. The difference does not seem to be explained by SSD I/O, nor by network I/O, nor by temperature. -
If, on average, RAPL accurately represents the variable part of a server, it is sometimes necessary to add more than 50W to obtain the overall consumption. This can sometimes represent more than 10x the electricity consumption reported by RAPL, and at the time of writing this article, we do not know how to explain this 50W.
Future research
This is only the beginning of our work. At this point we think several topics are worth exploring:
- Reproduce this work on different infrastructure and on different hardware.
- Verify precisely the consumption hypothesis of 2W per SSD. Study hard drives and NVMe, compare different models, compare idle drives and drives under heavy load, staying on orders of magnitude to the nearest Watt.
- Understand what makes up the constant 50W gap on simple 1U servers like the Pro-4-L. Ideally reproduce this difference in a home laboratory, with a wattmeter, to try to independently measure the consumption of the components.
- Determine a formula to estimate the overall consumption of a server from RAPL. In doing so, being very clear about the margins of error depending on the level of knowledge of the equipment.
- Ultimately, determine a formula to estimate the overall consumption of a server without even having RAPL. Again, being even clearer about the margins of error.
If you are interested in this subject, if you wish to contribute or if you simply have some information you want to share, you can contact us in two ways:
→ Send an email to energizta@boavita.org
→ Join the Energizta public chat https://chat.boavizta.org/public-boavizta/channels/energizta