Understanding the results of cloud providers' carbon calculators
CIOs are increasingly asked to include the impacts of their outsourced resources in their environmental accounting (classified as scope 3 emissions in a carbon assessment). To meet this need, the main cloud providers offer calculators to estimate the carbon emissions related to the use of their services. Communicating the impacts associated with the usage of its customers involves, on the one hand, evaluating the various impact items within the chosen perimeter, and on the other hand, allocating these impacts to each of its customers (all the more important as cloud services are highly mutualized).
The accounting process is highly dependent on the perimeter and the allocation rules chosen. It is therefore necessary to ask:
- What are these numbers?
- How do we explain them?
- What level of transparency is given?
In this article, we present the calculators of the three main cloud providers: Azure, GCP & AWS through their perimeter on the one hand and their allocation method on the other.
As the methods implemented are constantly evolving, this article is likely to evolve over time. The current information is valid as of April 30, 2023. This work is collaborative, so do not hesitate to inform us of any errors or request changes.
Vocabulary
-
Scope 1, 2 & 3 : https://www.climatepartner.com/en/scope-1-2-3-complete-guide
-
Allocation : The allocation process aims to distribute the impacts of a so-called “multifunctional resource” (i.e. one which serves several uses). In the context of the cloud, many resources are multifunctional, including cooling, networks, and internal services.
-
Location-based : The location-based method calculates the emissions related to electricity consumption according to the electricity mix of the region where consumption takes place.
-
Market-based : The market-based method calculates the emissions related to electricity consumption based on the electricity purchased by the consumer. Some players propose a dual reporting - location-based & market-based. Boavizta advocates for a systematic use of location-based methods. When both figures are reported, those evaluated with a location-based method must be given precedence.
-
Top-down : Top-down methods aim to establish environmental impacts by distributing the overall impacts of a system over all the functional units provided by that system. The advantage of this approach is that it is relatively simple to understand and implement. The disadvantage is that it tends to average the impacts of the different uses being assessed.
-
Bottom-up : Bottom-up methods aim to aggregate the impacts of the different resources used to implement the system being assessed (equipment, operations, third party services, etc.).
-
Overhead : We call overhead all the technical non-IT equipment present in the Data center (DC) which is necessary for the proper functioning of the services provided. This includes the power system, the cooling system, the lighting etc.
The Azure carbon calculator
Sources
- https://learn.microsoft.com/en-us/power-bi/connect-data/service-connect-to-emissions-impact-dashboard
- https://azure.microsoft.com/fr-fr/blog/microsoft-sustainability-calculator-helps-enterprises-analyze-the-carbon-emissions-of-their-it-infrastructure/
- https://download.microsoft.com/download/7/2/8/72830831-5d64-4f5c-9f51-e6e38ab1dd55/Microsoft_Scope_3_Emissions.pdf
- https://download.microsoft.com/download/7/3/9/739BC4AD-A855-436E-961D-9C95EB51DAF9/Microsoft_Cloud_Carbon_Study_2018.pdf
- https://learn.microsoft.com/en-us/industry/sustainability/api-calculation-method
Perimeter covered by the carbon calculator
Scope 1
Some scope 1 emissions are taken into account, but their perimeter is not specified in Microsoft’s methodology.
Scope 2
For Scope 2, electricity consumption is measured at the entrypoint to the datacenters. Microsoft thus obtains all of the electrical consumption consumed within each data center.
Emissions are communicated on a market-based basis. It is possible to find location-based metrics indirectly by adding the emissions “saved” by renewable energies to the market-based metrics. As a reminder, the GHG Protocol recommends reporting both figures. There are many arguments for considering only the location-based approach.
The Bilan Carbone® methodological guide (ADEME/ABC) is clear on this subject:
| The Bilan Carbone® is intended to reflect a physical reality and not a trade name. Renewable electricity production is rarely self-consumed, and is therefore very often connected to the national grid: this “green” production is therefore part of the national electricity mix. The development of “green” energies results in the reduction of the emission factor of the national electricity mix. |
|---|
In addition, the use of a market-based approach makes it difficult for users to follow their own footprint reduction progress.
Scope 3
For Scope 3, the emissions related to the extraction phases of raw materials, manufacturing and end of life of IT equipment are taken into account. However, transport-related emissions are excluded. Microsoft mentions the use of a lifecycle analysis method, but this is not made available.
Updating the data
Data related to scopes 1, 2 and 3 are updated on a monthly basis.
Conclusion
Beyond the lack of transparency in Scopes 1 and 3, Microsoft’s approach lacks part of Scope 3, namely emissions related to IT equipment transportation, buildings, employee commuting and also technical equipment (non-IT) of the data center.
Allocation
Evaluating the impact of a region
The impacts of Scopes 1 and 2 are modeled for each data center. Scope 3 impacts are assessed by aggregating the impacts of the manufacture and end of life of all IT equipment at the level of each data center. Using this method, Microsoft gets scope 1, 2 & 3 impacts for each of its data centers, then aggregates them per region.
Allocating the impact of a region to a specific service
To allocate the impacts of a region to the different services it operates, Microsoft uses a top-down method based on a cost metric that normalizes the consumption of its IaaS, PaaS and SaaS services. By combining the total amount of units consumed for each service type, and the total impact for a region, Microsoft obtains the total impact per service type per region. Since only end uses (IaaS, PaaS and SaaS) are counted, but all the impacts of the region are considered, the overall impact of the region is distributed proportionally among services according to their importance in that region.
Finally, the impacts of all the services are allocated to the customers according to the quantity of metrics of cost-normalized unit consumed for each service and for each region.
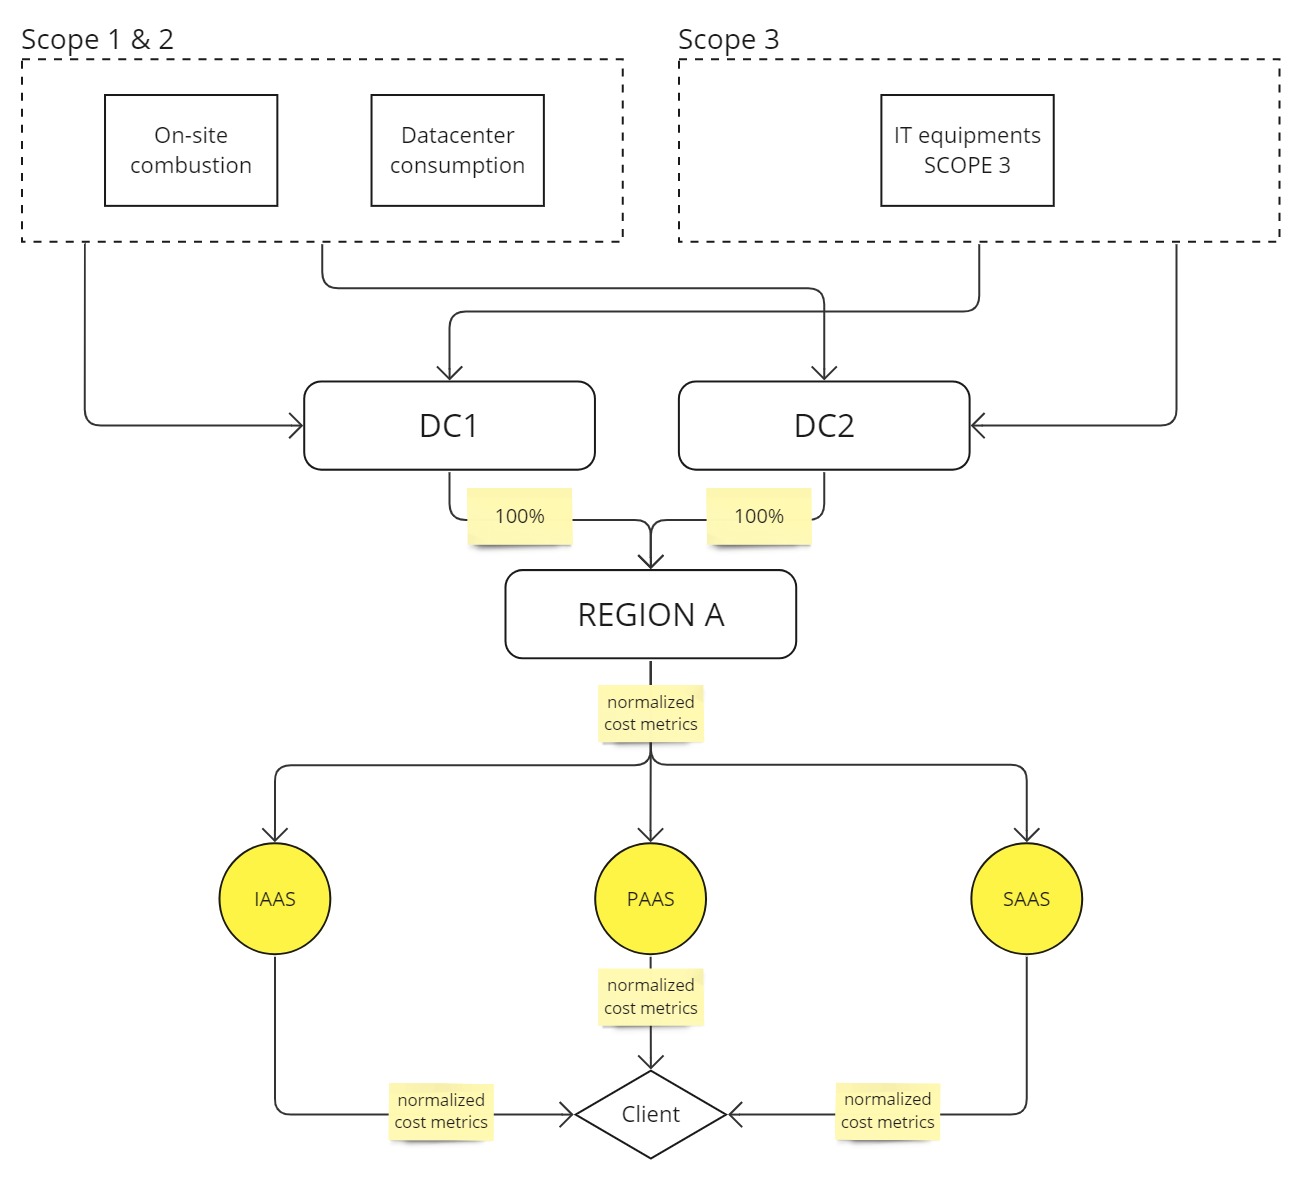
Microsoft’s approach distributes all the considered impacts to the services sold. However, the construction of a unique allocation key: “normalized cost unit” which scales the results is not transparent. This is a critical issue because such an allocation key is disconnected from the ground truth. Indeed, the relationship between cost and footprint becomes looser the higher up the service layers you go, with higher levels of mutualization: from somewhat tied for IaaS, loosely tied for PaaS and to vaguely tied for SaaS.
“Avoided” emissions
Azure also shares so-called “avoided” emissions versus an on-premise infrastructure. We will not go into the details of the limits of this methodology here, as they are already presented in this article : https://boavizta.org/blog/les-reductions-d-emissions-de-co2-promises-par-les-cloud-providers-sont-elles-realistes
The GCP carbon calculator
We only considered the methodology implemented for Google Cloud Platform (GCP) and did not consider other Google scopes such as Google Suite.
Sources
Perimeter
Scope 1
Scope 1 emissions are partly taken into account; Google includes emissions related to the burning of fossil fuels on data center sites, and the consumption of the thermal vehicle fleet. They acknoweldge the fact that fugitive emissions from HVAC system coolants are not currently taken into account.
Scope 2
For Scope 2, Google follows a bottom-up approach by taking into account the electrical consumption of IT equipment (compute, storage, network) as well as the overhead. The bottom-up approach allows a finer allocation of consumption to services. While more precise in what it does measure, this methodology covers a smaller perimeter, disregarding other sources of impact such as employee IT equipment, the power supply and lighting. However, the magnitude of these impacts is possibly negligible in comparison to the hardware that is covered.
Emissions related to Scope 2 are communicated using both a market-based approach and a location-based approach, as recommended by the GHG Protocol. However, there are many reasons to consider only the location-based approach. Location-based carbon intensities are assessed on an hourly basis using data from ElectricityMaps.
Scope 3
Finally, Google takes into account an almost complete Scope 3 with the emissions related to the manufacture of IT resources, the building, the travel of their collaborators with a bottom-up method. Google notes that emissions related to the end of life of equipment are not taken into account. According to Google, the method for taking into account the upstream Scope 3 impacts related to IT equipment follows a life cycle analysis approach. However, the details of this approach are not given.
Updating data
Scope 3 data is updated on a monthly basis. A lifespan of 4 years is used to exclude equipment from scope 3. Scope 2 related data is updated on an hourly basis. The electricity impact factors used are updated on an hourly basis.
Conclusion
It should be noted that the perimeter of the Google calculator is quite transparent on the elements taken into account and those not taken into account. The difficulty in taking into account elements outside the scope may explain why they are not included (lack of methods, data, etc.). Unfortunately there is a lack of transparency on the life cycle analysis data which forms the basis of the impact assessment, meaning we cannot comment on the accuracy of this aspect.
Allocation
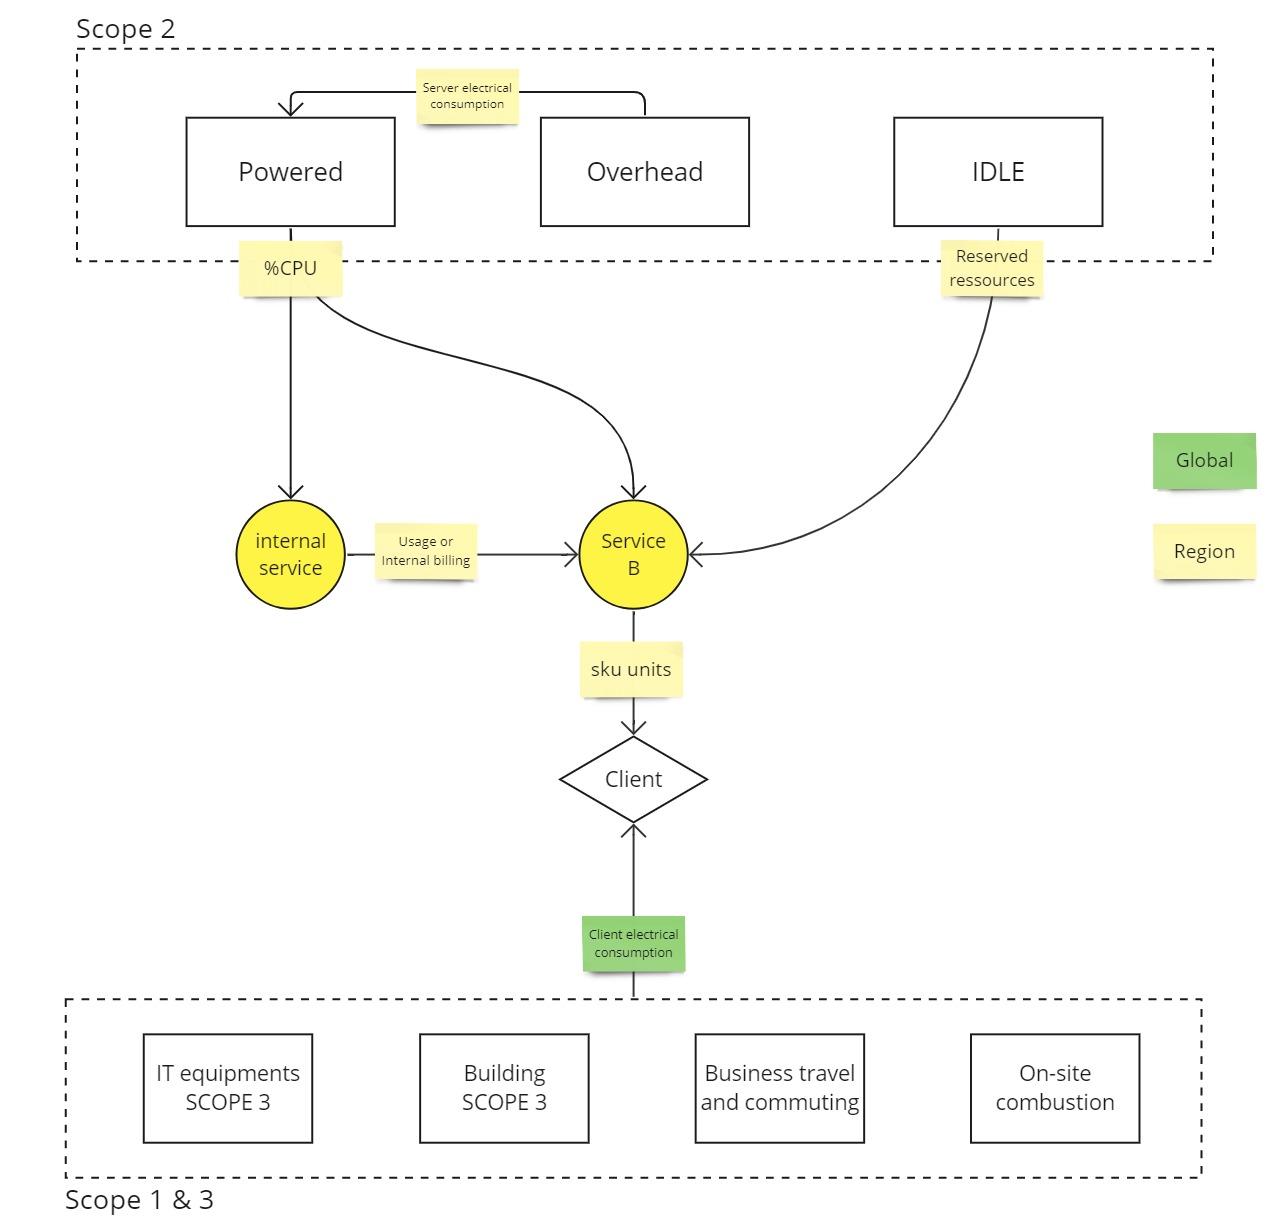
The impacts related to Scope 2 are allocated to each of the services available in the region depending on the type of impact:
Scope 2 allocation of IT equipment usage
The electricity consumption of the IT equipment used by systems is allocated to each system according to the percentage of CPU time used by the service per hour. This allocation rule makes it possible to distribute the consumption of a machine operating several services in one hour.
Scope 2 allocation of idle IT equipment consumption
As Google is taking a bottom-up approach, it is also necessary to take into account the consumption associated with unused IT equipment. The consumption of idle machines is allocated according to the proportion of IT equipment used by each service (IT equipment in the run phase). Google rightly considers idle machines to be used to provide high availability, the allocation by consumed resources makes it possible to attribute the impacts of these resources according to the additional reservation potential necessary for each of the services.
Scope 2 allocation of overhead for each service
To perform an exhaustive analysis, it is also necessary to take into account the consumption linked to overhead. This is allocated to each machine based on its own power consumption. The allocation is made for each of the zones and subzones of the DC. The consumption of a server is therefore considered to be its own consumption associated with the consumption of its “overhead”.
Scope 2 allocation of each internal service
At this point, Google has hourly power consumption per internal service and sold service. Impacts related to internal services are allocated to services sold in proportion to the use of internal services used by the services sold.
Scope 2 allocation to customers using a service
The allocation mechanisms described above make it possible to obtain an hourly electricity consumption per service sold per region. The associated impacts are assessed using a location-based method using data provided by ElectricityMaps.
Finally, the impacts related to Scope 2 of each of the services are allocated to each customer according to the quantity consumed out of the total quantity delivered, with a distribution key linked to invoicing (Stock Keeping Unit SKU). As with Azure, such an allocation key moves away from the physical effects actually at work. However, it is only used for the final allocation to users and not to calculate the impacts of services (which follow a bottom-up approach). The SKU values of each of the services is available to users.
Allocation of scopes 1 and 3 to customers
Impacts related to Scope 1 & 3 are allocated in a non-regionalized top-down manner. All of GCP’s global Scope 1 & 3 impacts are distributed to customers based on the proportion of energy consumed per customer (calculated above). This type of allocation does not take into account the specifics of the impacts related to scope 1 & 3 of the different services. This is problematic because the relationship between electricity consumption and scope 3 impacts is not linear and changes depending on the types and uses of services. In particular, some services reserve a large quantity of equipment (significant Scope 3 impact) but are underutilized (consuming little electricity).
The AWS carbon calculator
Source
Perimeter
Only impacts related to Scope 1 and Scope 2 are included in the scope of the AWS calculator.
The calculator includes only a market-based approach, and the precise scope of the activities taken into account is not documented.
Allocation
The allocation approach is not documented.
There is a general lack of transparency around the AWS calculator, perhaps due to its lack of maturity. However, it should be noted that AWS puts more emphasis on its Well-Architected Sustainability Pillar (GreenOps good practices) than this calculator, which is much less advanced than that of its competitors.
Conclusion
This review of the different methods implemented by CSPs shows the plurality of approaches that coexist in a sector lacking standardization.
Tools like cloud-scanner (under development by Boavizta) or Cloud-carbon footprint offer transparent, granular and standardized alternatives. However, they are limited to the architectural data made available by the CSPs. One of the consequences is a tendency to significantly underestimate the impacts by ignoring some of the resources and energy consumed by internal services. Work such as that carried out by ADEME through their PCR (Product categroy rule) Datacenter and cloud or those carried out by SDIA on the opening of environmental data for data centers, are examples of initiatives encouraging more standardization and transparency in the sector.
Beyond the impacts related to greenhouse gas emissions, the public is increasingly interested in other impacts caused by hyperscalers, such as the recent controversy over the use of water from a Microsoft DC during a drought in the Netherlands, land use or issues related to waste (buildings, D3E, etc.). It is important to have a multi-criteria approach to understand all the environmental impacts of digital services, and to avoid pollution transfers. In this regard, Boavizta’s Cloud-scanner implements the multi-criteria methods proposed by Boavizta.
Finally, for these indicators to be useful they must be integrated into the strategies of IT departments . Regarding this last point, we are looking for feedback for a future article on the ways organizations use these calculators.
Perimeters: Synthesis
| Item | SCOPE \ (relative to provider) | AZURE | GCP | AWS |
| Life cycle stage | ||||
| Extraction | 3 | YES | YES | NO |
| Manufacture | 3 | YES | YES | NO |
| Usage | 1 & 2 | YES | YES | YES |
| End of life | 3 | YES | NO | NO |
| Item | ||||
| Building | 3 | NO | YES | NO |
| IT Equipment | 2 & 3 | YES | YES | YES |
| Overhead | 2 & 3 | YES | YES | ? |
| Employee commutes | 3 | NO | YES | NO |
| Fugitive emissions from HVAC system coolants. | 1 | ? | NO | ? |
| Impacts of IP traffic | Depending on the type of infra | YES | NO | ? |
| On-site combustible fossil energy source | 1 | ? | YES | YES |
| Idle Resource Impacts | 2 & 3 | YES | YES | ? |
| Impacts of internal services | 2 & 3 | YES | YES | ? |
| Methodology of the carbon intensity of electricity | ||||
| Line loss | 2 | ? | NO | ? |
| Manufacture of energy infrastructure | 2 | ? | YES | ? |
| Location Based | 2 | Indirectly | YES | NO |
| Market Based | 2 | YES | YES | YES |
Allocations: Summary
| Item | AZURE | GCP | AWS |
| User-specific | NO | NO | ? |
| Service-specific | Partially | SCOPE 2 | ? |
| Region specific | YES | SCOPE 2 | ? |
