Are the CO2 emission reductions promised by cloud providers realistic ?
Cloud providers are increasingly communicating their responsible values , during a time when Ireland and the Netherlands are establishing a moratorium on the installation of new hyperscale data centers.
The cloud market continues to grow: in Europe it is predicted to reach parity with the telecom market by 2027, some 260 billion euros, 65% of which is currently held by Amazon, Microsoft and Google (see Le Monde).
For several years now, these same players have presented the move to cloud as beneficial from an environmental point of view, claiming that it can reduce CO2eq emissions by up to 96% vs. on-premise infrastructure. Is this figure realistic ? How are such environmental gains calculated ?
This article decrypts the figures announced by Microsoft, Google and AWS.
The promises of the main cloud providers: reduce the CO2eq emissions of an application by up to 96% with a move-to-cloud
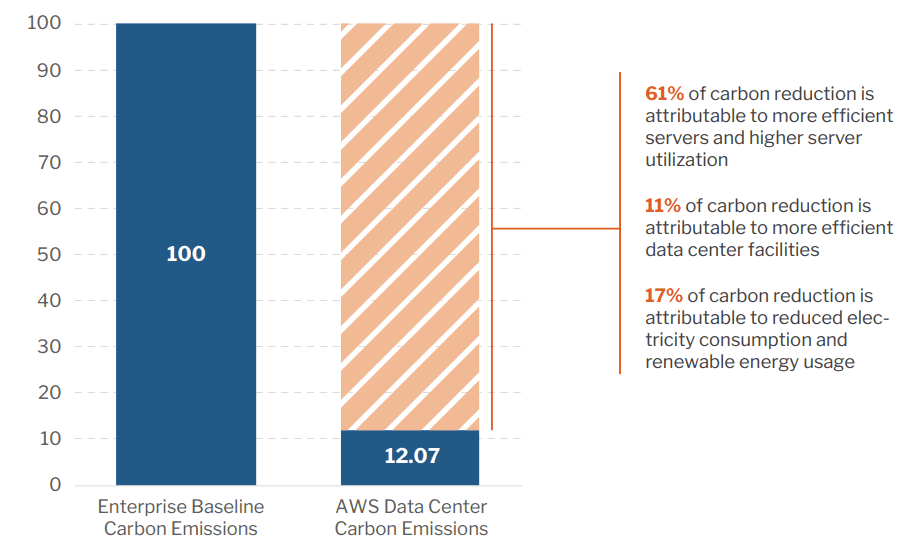
A maximum CO2 reduction thanks to the efficiency of data centers (AWS)
The 451 Research study conducted on behalf of AWS in 2019 estimates the carbon savings achieved by transferring an on-premises workload to the cloud at 89%. This figure applies to activities across the Atlantic; in Europe the gain could reach 96% with the use of data centers powered by renewable energy.
Switching to Azure would allow reduction of electricity consumption by 22%… to 93% depending on the services used (Microsoft)
In its report [“The Carbon Benefits of Cloud Computing”]](https://download.microsoft.com/download/7/3/9/739BC4AD-A855-436E-961D-9C95EB51DAF9/Microsoft_Cloud_Carbon_Study_2018.pdf), Microsoft compares its cloud services Azure Compute, Azure Storage, Exchange Online and SharePoint Online with two different indicators:
- The electricity consumed by the service: the focus is therefore on the energy efficiency of the cloud.
- The CO2eq emissions of the service, including the electricity consumed as well as the entire life cycle of the underlying equipment (therefore including the manufacture, transport and recycling of equipment).
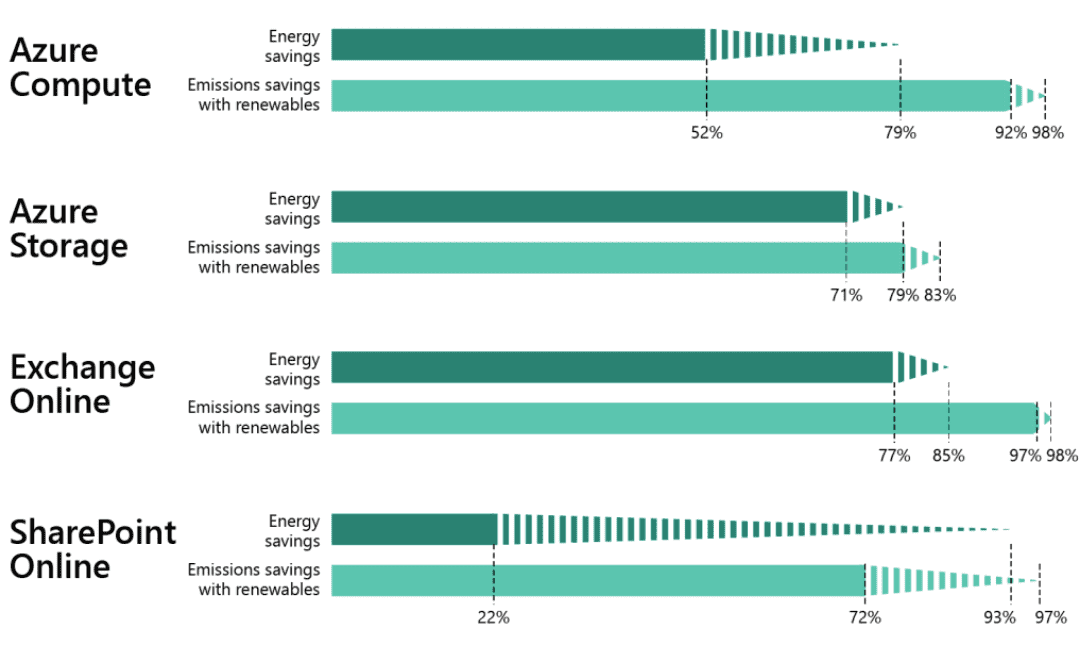
From the point of view of electricity consumed/energy efficiency, Microsoft estimates gains of 52% to 93% depending on the services:
- Azure Compute: decrease in power consumption from 52% to 79% per core per hour depending on the maturity of the on-premise deployment (79% reduction in consumption if dedicated physical servers - 52% if the on-premise servers are virtualized),
- Azure Storage: 71% to 79% electricity savings per TB per year depending on whether the storage is local or shared,
- Exchange Online: 77% to 85% electricity savings per mailbox per year,
- SharePoint Online: 22% to 93% of electricity saved per user per year,
This reduction in energy consumption translates to a reduction in CO2 emissions for each service. Microsoft even announces reaching a 98% reduction in CO2eq in areas where Azure services would be powered by renewable energy:
A reduction in CO2eq emissions from the cloud is halved if we consider those of smartphones and user computers (Google Cloud)
As early as 2011, Google analyzed the benefit of switching to the cloud for the use of business messaging (Gmail) and office applications (Google Apps). The study highlights the energy saving gains and the reduction of associated carbon emissions:
- Google shows (for services in 2010) a 98% reduction in the carbon footprint by switching its corporate email to Gmail (Google Green Computing), and 85% for office applications (Google Apps: energy efficiency).
- Google qualifies these figures by indicating that the reduction in CO2eq emissions is only 40% if we also integrate the user equipment to access these services (smartphones and user computers are the same whether the service is in the cloud or data center).
- It is also mentioned that moving towards the cloud tends to increase network traffic by 2-3%.
Our interpretation: what criteria do Amazon, Microsoft and Google use to measure the impact of their cloud services?
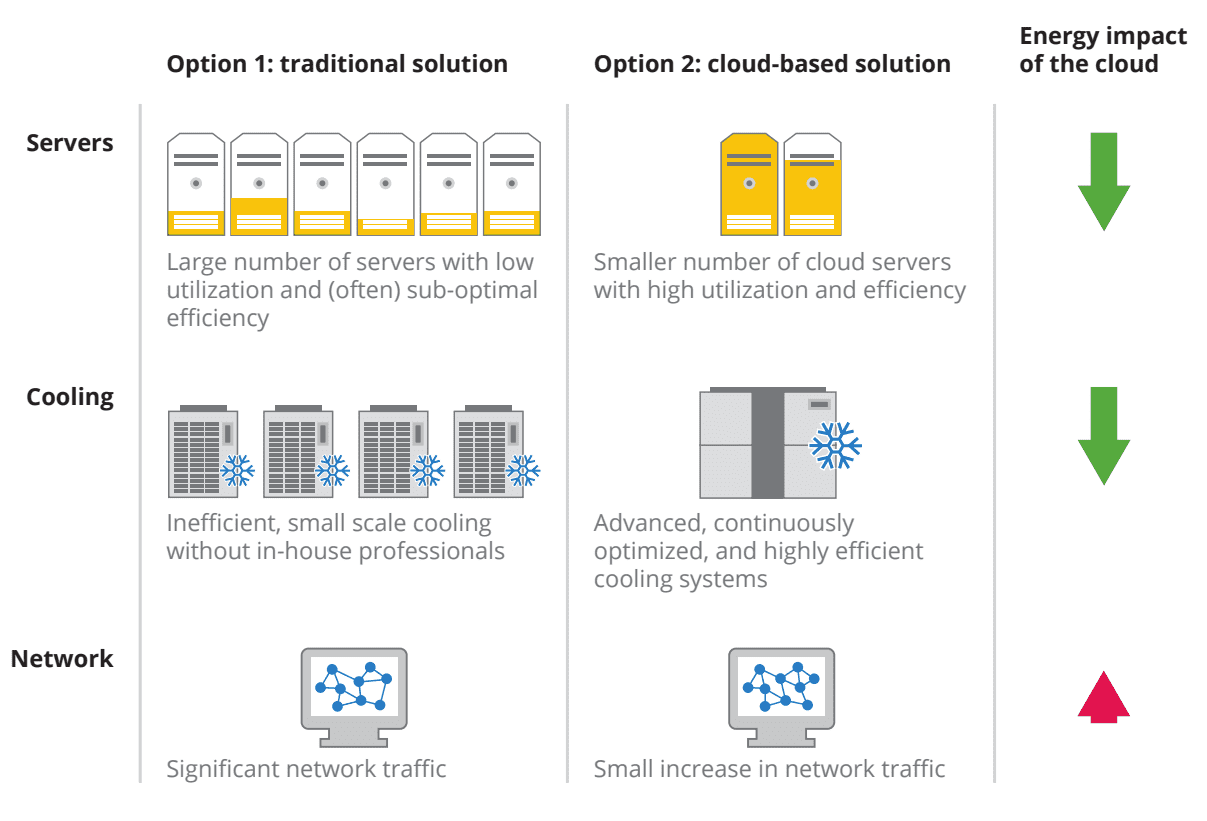
The pooling of resources and the efficiency of the public cloud
The 3 cloud providers put forward the same arguments to justify the energy efficiency gains - and therefore the reduction of CO2eq emissions - namely:
- Pooling of resources on a large scale
- Better server utilization rates
- Specific and more efficient IT equipment
- Optimal data center management and extremely low PUE (Power Usage Efficiency)
Cloud providers are extremely efficient at pooling and resource management; however, data center operators such as Telehouse or Equinix also apply these same principles to optimize the utilization and consumption of their resources.
To justify the efficiency gains between an on-premise datacenter and the public cloud, it would therefore be appropriate to consider a state-of-the-art datacenter as the basis for the calculation, which can then be compared to the datacenters of cloud providers. The on-premise datacenter taken as a reference is inconsistently specified in the reports of the 3 cloud providers.
Differences between cloud providers in measuring the carbon footprint of electricity consumption
Measuring the impact of energy consumption can be done differently from one study to another, introducing discrepancies that complicate the reading of the impact of the cloud reported in these studies.
The method for calculating CO2eq emissions
Google provides the CO2eq emissions of its electricity consumption using the location-based method, while Microsoft and Amazon provide the CO2eq emissions using the market-based method:
- The location-based method takes into account the electricity mix of the data center location. This method takes into account the actual physical consumption (e.g. the carbon intensity of the French electricity mix will be used for a data center located in France)
- The market-based method does not correspond to actual consumption, instead integrating the purchase from the Renewable Energy Guarantees of Origin market (REGO), and the financing of additional Renewable Energy capacities via a long-term contract (Power Purchase Agreement – PPA). It is therefore a ‘purely accounting’ based approach, rather than a physical approach to the carbon intensity of electricity.
The GHG Protocol standard recommends reporting both market- and location-based figures when analyzing CO2eq impacts (see GHG Protocol Scope 2 Guidance - section 1.5.1); a clarification that would bring more transparency to the assumptions made (see Offsetguide - location-based vs market-based). It should be noted that in France, regulations do not allow this market-based approach when reporting company level CO2e emissions : “The assessment of the impact of electricity consumption in the GHG emissions report is carried out on the basis of the average emission factor of the electrical network (…) The use of any other factor is prohibited. There is therefore no discrimination by [electricity] supplier to be established when collecting the data.” (Regulatory method V5-BEGES decree). Methodological standards designed specifically for assessment of environmental impacts of digital services (which includes hosting activities) also explicitly prohibits taking into account carbon offsetting and green certificates (see PCR Digital Services, section 6).
Taking into account the electricity mix of the country where the datacenter is located
Microsoft and AWS use the carbon intensity of the United States or Europe to measure the impact of on-premises infrastructures and compare it to the average carbon intensity where Cloud services are located. (see Microsoft p22 report and AWS analysis). Knowing that each country has different means of energy production, this adds a margin of error on the expected gains:
- The European mix can be very different from one country to another: for example, the European Environment Agency gives the following carbon intensity (source): Netherlands - 328gCO2eq/kWh | France - 51gCO2eq/kWh | Ireland - 278gCO2eq/kWh,
- The electricity map site also gives a variation of 25g to 739g of CO2eq /KWh for the different zones/regions of the USA.
The expected gains from a move to cloud must therefore take into account the carbon intensity of the electricity mix of the on-premise datacenter vs. the electricity mix of the chosen cloud region (which can be more or less carbon-intensive).
Taking into account the consumption of user equipment
Finally, GCP is the only one to take into account the 3 different modes of accessing Google services tiers (user equipment, network, cloud). Considering only the cloud service, the reduction in CO2 emissions reaches 80% - but drops to 40% when we consider all 3 modes.
We can therefore question the expected gains from a move to cloud at AWS or Microsoft if we add the contribution of user hardware. The announced figures do not relate to the complete digital service, but only to its data center part.
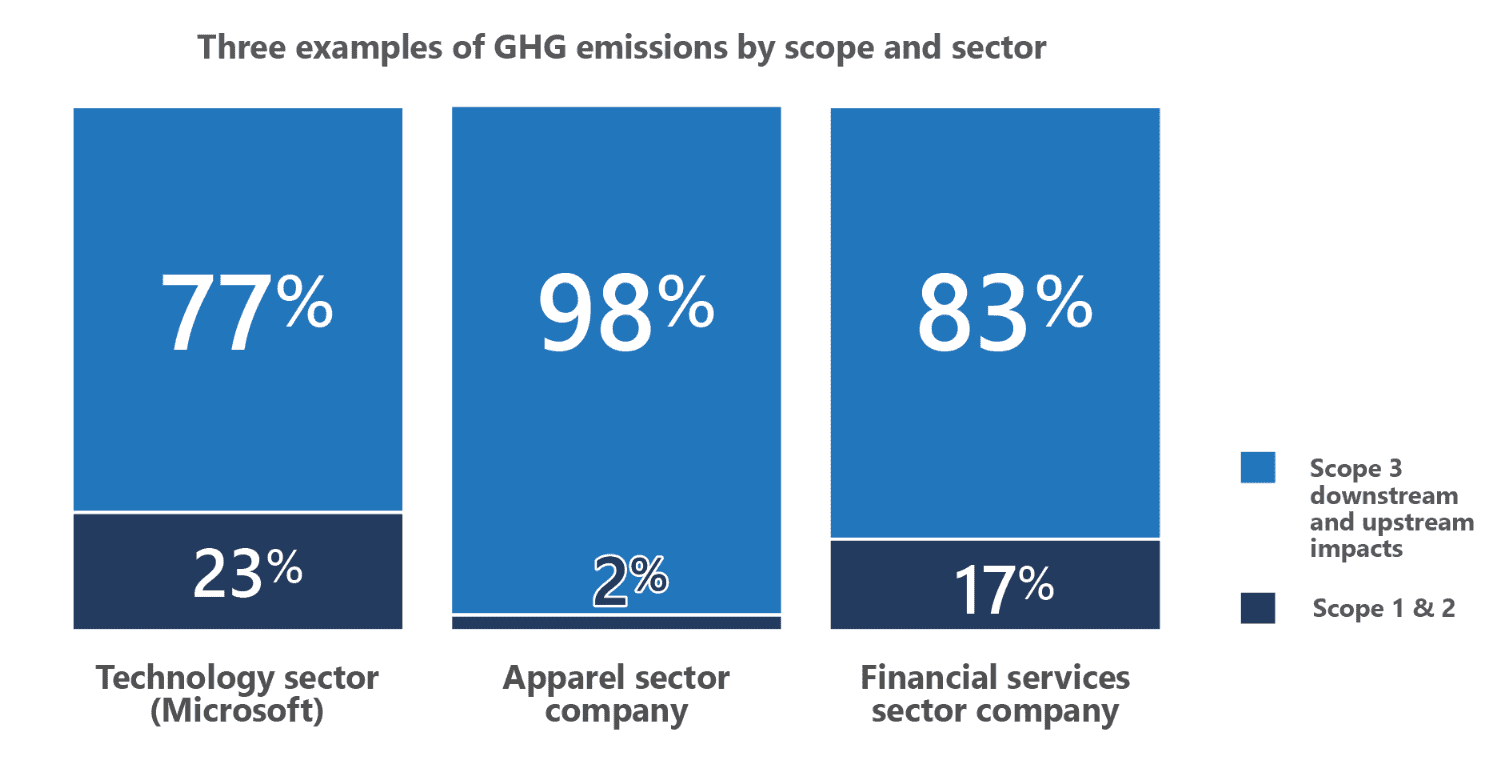
Discrepancies in taking into account the impacts related to the manufacture and transport of equipment
See this figure from Benjamin Davy, to get how scope 1, 2 and 3 are applied in the context of datacenters.
_AWS announces that scope 3 (i.e. impact of material - manufacturing, transport - and buildings) is negligible: “Future versions of the model may include some Scope 3 emissions with embodied carbon calculations for facility and IT systems, but we don’t expect that to meaningfully alter the conclusion of the analysis.” (report p18)._
There are, however, a few factors to consider that can differentiate AWS scope 3 vs on-premise:
- The lifespan of equipment: AWS says in its report (dating from 2019), that it renews its equipment more frequently than a traditional datacenter. This strategy lets users benefit from technological advances while optimizing the power/energy consumption ratio, but encourages the manufacture of new equipments, and thus increases the environmental impact
- However, all three providers are evolving, and looking to extend the useful life of servers and network equipment: a strategy that therefore reduces their scope 3 impact (recent announcements from AWS, Microsoft or Google)
- If cloud providers show higher utilization and virtualization rates, their ability to run the same workload therefore requires less equipment than an on-premise configuration. Less equipment means less impact related to the manufacture, transport and recycling of this equipment, which could therefore reduce the impact of cloud vs on-premise
Microsoft claims that the CO2eq gains on the scope 3 are greater than those announced for scope 2 (electricity consumption): for Azure Compute for example, the gains range from 52-79% for scope 2 impact, to 58%-88% for scope 3 impact. Microsoft therefore considers that the scope 3 impact of its data centers is lower than that of an on-premise datacenter.
How can this difference be justified? No details are given on the calculation of these figures, but Microsoft assumes a recycling rate of 20% of its equipments: this recycling makes it possible to account for negative CO2eq emissions. It can also be estimated that the transport of large volumes of equipments makes it possible to reduce the overall impact of the transport when amortized over units transported.
In a more recent report from 2021, Microsoft adopts a new approach to accounting for scope 3 emissions. This analysis puts into perspective the impact linked to electricity consumption (scope 2) which would represent only 25% of carbon emissions - and the impact of scope 3 (manufacturing, purchasing, transport of materials and buildings) which would therefore represent 75% of the carbon impact.
If we keep in mind the ratio announced by Microsoft (carbon impact = 25% electricity consumption + 75% materials / buildings), we quickly understand that the Carbon-Free Future plans as put forward by Google are confusing. Google’s 2030 vision Realizing a Carbon-free Future is only about generating energy to power data centers. With the ambition of supplying all of its data centers with “carbon-free energy” by 2030 (announcement 2020), Google’s ambitions are based on a complex system:
- The construction of renewable energy plants, which themselves generate a carbon impact, and which also consume raw materials whose predicted shortage in2030 is already undermining Europe’s energy transition ambition (University of Louvain 2022 for Eurométaux),
- The purchase of renewable energy contracts (PPA) which make it possible to reserve the production of carbon-free electricity in the long term - but also depend on a global renewable energy production whose capacity cannot exceed 30% globally (EIA),
- The purchase of renewable energy certificates (GoOs - Guarantees Of Origin or REC - Renewable Energy Certificate), an accounting compensation mechanism with no physical benefit, which certifies that a quantity equal to the energy consumed locally has been produced somewhere renewably.
No energy (even renewable) emits 0g of CO2eq. Using carbon-free energy terminology and thus justifying that data centers do not emit CO2 is a misleading shortcut that can undermine the efforts made by CSPs.
The Cloud, a performance lever with an increasingly strong environmental impact
In a period of energy tension and scarcity of raw materials, the cloud, long considered immaterial and unlimited, is increasingly cited for its environmental impact. The carbon-free energy messaging of cloud providers - sometimes associated with the carbon neutral of GAFAM - is not resonating with organizations that use the cloud.
The potential benefit of a migration to the public cloud requires a solid methodology, taking into account all the end-to-end elements of the digital service to be migrated; the risk of rebound effects and the additional environmental cost of the project (double run); and taking into account the geographical location and its energy mix. The gains in reducing CO2 emissions as communicated by the cloud providers cannot be taken at face value by CIOs.
Through these reports, we can expect Google, AWS and Microsoft to standardize and clarify their impact calculation methods, in order to better inform their users (i.e. organizations’ cloud teams). The prevailing approach to addressing this currently is via cloud carbon impact calculators. These calculators should be based on open, standard and auditable assessment methods such as the one published in January 2023 by ADEME, the French environmental agency (PCR Datacenter and cloud). It is only when using such methods with a common public impact factor database that resultings number could be used for comparison across cloud service providers, which is currently all but impossible.
The cloud remains an efficiency lever for organizations: beyond the efforts expected from cloud providers themselves, we expect users of cloud services to engage in eco-design practices, to challenge their uses, and to measure the performance of their cloud services to limit their impact.
| Boavizta is an inter-organization working group that supports discussions and the sharing of practices for measuring the impact of digital technology. This article is part of an analytical work on cloud impact measurement methodologies and the tools available to cloud teams to measure their impact. Future publications on these topics are forthcoming, any contribution to the working group is welcome. |
|---|
Sources :
- The Carbon Reduction Opportunity of Moving to Amazon Web Services, 451 Research - 2019
- Cloud computing, server utilization and Environment, Jeff Barr - 2015
- The carbon benefits of cloud computing, Microsoft - 2020
- A new approach for scope 3 emissions transparency, Microsoft - 2021
- Google’s Green Computing : Efficiency at Scale, Google - 2011
- Google Apps : Energy Efficiency in the Cloud, Google - 2012
- Datacenter Efficiency, Google website
- Metals for Clean Energy: Pathways to solving Europe’s raw materials challenge, Eurométaux - Avril 2022
- Electricité verte : un outil pertinent pour les entreprise ? Carbone 4 - Novembre 2018
- Datacenter energy water intensive tech
- En Irlande les critiques contre les datacenters poussent Amazon et Microsoft a revoir leurs plans, L’Usine Nouvelle